Monitoring the photosynthetic performance of grape leaves using a hyperspectral-based machine learning model
Zhenfeng Yanga, Juncang Tiana, b, c, *, Zhi Wangd, Kepeng Fenga, b, c
a School of Civil and Hydraulic Engineering, Ningxia University, Yinchuan, Ningxia
750021, China
b Engineering Technology Research Center of Water-Saving and Water Resource Regulation
in Ningxia, Yinchuan, Ningxia 750021, China
c Engineering Research Center for Efficient Utilization of Modern Agricultural Water
Resources in Arid Regions, Ministry of Education, Yinchuan, Ningxia 750021, China
d Department of Earth and Environmental Sciences, California State University, Fresno,
CA 93740, USA
Article Info
Keywords: Photosynthetic; Machine learning; BNN model; Chlorophyll fluorescence
Abstract
Photosynthesis is a direct expression of the crop growth status and an important indicator predicting yield and quality. Rapid and accurate monitoring of the dynamics of photosynthetic is key to field management. In this study, we obtained photosynthetic pigments and water status parameters at the leaf scale during different growth periods of grape. The potential maximum quantum yield (Fv/Fm) of photosystem II (PSII) under dark adaptation and the light response curve (LRC) of the PSII electron transfer rate (ETR) under light adaptation were measured using a pulse amplitude modulated (PAM) chlorophyll fluorometer, while leaf spectral information was recorded using a hyperspectral imager. The maximum ETR (ETRmax) and initial quantum efficiency (kα) were calculated using the LRC model. A Bayesian neural network (BNN) model (implemented in Tensorfolw2.8) was developed to predict Fv/Fm, ETRmax and kα by quantifying the spectral response indices of photosynthetic pigments and water status parameters. A comparison was made with the partial least squares (PLS) and photochemical reflectance index (PRI). The results show that BNN, PLS model and PRI have better predictive performance for Fv/Fm than ETRmax and kα. Compared with the PLS and PRI, the BNN model was able to significantly improve the prediction accuracy, where the validation results for Fv/Fm were R2 of 0.78, ETRmax of 0.57 and kα of 0.53. In addition, the importance of the BNN model input features varied with Fv/Fm, ETRmax and kα, with the vegetation index describing the photosynthetic pigments having the highest importance. The PRI had the worst predictive performance probably because the de-epoxidation state of the xanthophyll cycle pigments is strongly influenced by temporal changes. The model developed in this paper for monitoring photosynthetic performance parameters in grape leaves can simplify the complex photosynthetic reaction process, expand the application of PAM technology and provide a method for rapid and accurate monitoring of photosynthetic performance.
1. Introduction
Crops exchange energy through the process of photosynthesis to produce yield. Photosynthetic parameters can be used to assess crop growth and atmospheric carbon exchange (Inoue et al., 2008). Water status and photosynthetic pigments are intrinsic to photosynthetic performance; they are involved in complex chemical reactions in the chloroplast and the stroma, which together determine photosynthetic performance under the action of external environmental factors (temperature, rainfall, radiation), and this relationship is regulated through field management. Keeping track of the photosynthetic performance of crops through remote sensing is essential for field management, especially in the context of global warming and frequent climate extremes, and monitoring crop growth is key to agricultural production (Hong and Abd El-Hamid, 2020; Lu et al., 2020; Ma et al., 2021).
Photosynthetic pigment molecules absorb energy from solar radiation, most of which is converted into photosynthetic products to maintain normal physiological activity, while the rest is dissipated as heat and chlorophyll fluorescence (ChlF) (Kalaji et al., 2017a). Therefore, there is a competitive relationship among photosynthesis, heat dissipation and ChlF at any moment of energy exchange (Baker, 2008). Consequently, ChlF can be used as an indicator of photosynthesis (Baker, 2008; Yang et al., 2021). ChlF shows a high sensitivity to growth status under mild drought stress (Daumard et al., 2010), which facilitates drought monitoring.
The electron transport rate (ETR) was shown to have close relationships with stomatal conductance (gs) and can be used as indicators of stomatal opening and closure (Kalaji et al., 2017b). Within a certain range of photosynthetic active radiation (PAR), the ETR increases with increasing PAR. This process can be modelled using the light response curve (LRC)(Dong et al., 2016), which was well modelled in previous studies using an exponential model (Mariann, Proctor, 2004; Proctor, Bates, 2018). In general, at low levels of PAR (<200 µmol m− 2 s− 1), ETR increases at a relatively stable rate (initial quantum efficiency kα). PAR causes photoinhibition when it exceeds the absorption capacity of the leaves. Therefore, ETR increases with PAR to reach a maximum value, ETRmax. The LRC process, which provides useful information, is a photosynthetic response function of the physiological status and contributes to detailed ecophysiological evaluation (Huang et al., 2012; Zhang et al., 2011). The detailed process of obtaining the LRC of ETR depends on the core parameters ETRmax and kα. In the past studies, ETRmax and kα were used to evaluate the photosynthetic capacity of leaves.
Pulse amplitude-modulated (PAM) technology offers opportunities for ETR light-response measurements. At the leaf scale, PAM fluorometers can accurately measure the photosynthetic physiological status of plants (Yang et al., 2017). Not only can the LRC process of ETR in the light-adapted state be obtained, but also the Fv/Fm (the ratio of variable fluorescence Fv to maximum fluorescence Fm, indicating the potential maximum quantum yield of PSII) of PSII under dark adaptation can be measured by stimulating saturated pulsed light, which can be used to assess the potential maximum photosynthetic capacity of leaves. Fv/Fm varies regularly with external stresses, such as temperature and drought (Bellot et al., 2004; Ogaya et al., 2011; Prieto et al., 2009), which can provide a reference for monitoring crop stress.
Although PAM technology can accurately monitor crop photosynthetic performance, it is difficult to achieve continuous spatial monitoring at the field scale due to its concentration at the leaf scale. A small airborne platform equipped with spectral equipment can flexibly obtain spatially continuous field spectral information (Haghighattalab et al., 2016; Romero et al., 2018; Sankaran et al., 2015; Zhang et al., 2019), which makes it possible to establish a direct connection with crop photosynthetic performance parameters by using spectral information, thus greatly expanding the application prospect of PAM technology. In previous studies, great progress was made in monitoring plant physiological and biochemical parameters using spectral information, and the monitoring range included leaf area (Chen et al., 2003; Gitelson et al., 2003; Liu et al., 2021), plant height (Jurjević et al., 2020; Watanabe et al., 2017), biomass (Ali et al., 2015; Jin et al., 2014) and biochemical parameters, such as chlorophyll (Peng and Gitelson, 2011; Schlemmer et al., 2013), nitrogen (Camino et al., 2018; Chen et al., 2010), carotenoids (Zarco-Tejada et al., 2013b), leaf water potential (Pôças et al., 2020), water status parameters (Penuelas et al., 1997; Yi et al., 2014), quality (Suarez et al., 2021) and other parameters. The noncontact spectral detection of these photosynthetic pigments and water status parameters provides more possibilities for monitoring crop photosynthetic performance. The photochemical reflectance index (PRI) is sensitive to the de-epoxidation state of xanthophyll cycle pigments and the efficiency of photosynthesis (Suárez et al., 2008), which are involved in photosynthetic system reactions and thus allow monitoring of photosynthetic performance. Zarco-Tejada et al. (2013a) calculated the new index, PRInorm, which improves the sensitivity of the PRI to the physiological and structural status by adding the index renormalised difference vegetation index (RDVI), which reflects the structural status of the canopy. However, photosynthetic responses involve the interaction of factors, which is the main reason for the limited accuracy when predicting photosynthetic performance directly using a single vegetation index.
Machine learning (ML) provides a new idea for simplifying the complex photosynthetic reactions in leaves. The nonlinear relationship between independent variables and dependent variables in ML can provide the basis for the interaction between internal factors of photosynthetic reactions and can be adjusted according to the dynamic changes of factors; thus, it is more flexible than mechanical and semi-empirical models (Reichstein et al., 2019). Wolanin et al. (2019) used a neural network (NN) model to accurately estimate C3 crops gross primary productivity (GPP), with an R2 value of 0.82. Shah et al. (2019) estimated the chlorophyll content of wheat leaves by random forest methods and showed a significantly lower RMSE when using machine learning methods compared to standard linear regression. In recent years, deep learning (DL) methods have attracted more attention. The existence of multiple hidden layers enables the DL method to approximate a highly complex nonlinear relationship (Kamilaris and Prenafeta-Boldú, 2018) and to better explain abstract target parameters (Lobell, 2013; Ma et al., 2021). In addition, the nonlinear transmission between multiple hidden layers can filter out noise (Shah et al., 2019) and greatly improve the adaptability in various application scenarios. Abdalla et al. (2020) established a convolutional neural network (CNN-LSTM) model with long short-term memory (LSTM) to monitor the nutritional status of rapeseed and achieved good application results. Barbosa et al. (2020) used convolutional neural network (CNN) to build corn yield prediction models with a 29% reduction in RMSE compared to random forest (RF) models.
In this study, we used a Bayesian neural network (BNN) model to predict the photosynthetic performance parameters Fv/Fm, ETRmax and kα. BNN can avoid overfitting of traditional neural networks by introducing probability distributions into the weights of neurons (Ma et al., 2021). During two years of field observations (2020–2021), we recorded data on grape growth conditions, including leaf photosynthetic pigment content, water status parameters, chlorophyll fluorescence parameters, hyperspectral information, yield, quality and field management. The vegetation indices representing photosynthetic pigments and water status parameters were selected to predict the photosynthetic performance parameters through the BNN model. The results of this study can provide technical support for the accurate prediction of crop photosynthetic performance.
2. Materials and methods
2.1. Study area
The study area is located in the grape-planting area at the eastern foot of Helan Mountain in Yinchuan city, Ningxia Province, China, and is located in the “golden zone” (105◦ 45′ 39′′ − 106◦ 27′ 35′′ E, 37◦ 43′ 00′′ − 39◦ 05′ 03′′ N) of grape planting. The region has a dry climate, typical of a continental climate, is rich in light energy resources, has a long sunshine duration (2851–3106 h annually), a large temperature difference between day and night, an effective cumulative temperature from July to September that can reach 961.6 ℃, and an annual average precipitation of 193.4 mm. The terrain is flat and undulating, with small, shallow gullies and lightly eroded soils. The soils are light grey calcareous, mostly sandy loam, with some containing gravel, and reaching a depth of 40–100 cm. The grapes in this region turn colour in August, when the temperature difference between day and night is large (10–15 ◦ C) and the grapes can accumulate sugar. Fig. 1 shows the recorded agrometeorological data.
2.2. Field observations
To evaluate the growth of grapes under farmer management, field observations were carried out for two years without experimental treatments. The same plants were chosen for field observations each year, with the aim of accurately monitoring grape growth characteristics. Such observations were based on the assumption that all vineyard plantings were homogeneous and that there was consistency in field management and soil conditions.
The grape variety was 7-year-old Cabernet Sauvignon. Before planting, the soil was tested for nutrients at a depth of 0–40 cm. The pH was 8.94, the total salt content was 0.33 g/kg, the organic matter content was 18.31 g/kg, the alkaline digested nitrogen content was 80.79 mg/kg, the available phosphorus content was 34.97 mg/kg, and the available potassium content was 71.86 mg/kg. The irrigation method was drip irrigation with a drip head spacing of 30 cm and a drip head flow rate of 2.3 L/h. The drip irrigation pipes were 40 cm above the ground, and all irrigation water was sourced from the Yellow River. Field management, such as pruning, weeding and application of pesticides, was carried out during the trial to ensure proper growth of the grapes. Fertilisation treatments were compared between years, specifically with fertiliser application (2020) and no fertiliser (2021). Before the beginning of the field observations (2019), we conducted field experiments with different irrigation and fertilisation treatments (experimental treatments are shown in Table 1) to obtain water and fertiliser management thresholds under optimal quality and yield and to provide a management basis for field observation without treatment. We determined the quality indicators of grapes, including soluble solids, reducing sugars and total acids.
| Treatment No. | Irrigation water consumption (m3/hm2) | fertilizer amount(kg/hm3) |
|---|---|---|
| T1 | 1395 | 291 |
| T2 | 1845 | 175 |
| T3 | 2295 | 233 |
2.3. Collection of sample parameters
2.3.1. Chlorophyll fluorescence parameters
In this study, we measured leaf ChlF parameters using a MINI-PAM-II chlorophyll fluorometer (WALZ, Germany). To avoid midday sunlight, measurements were taken between 8 am and 12 pm. All samples were collected between June and October, the period between late flowering and ripening of wine grapes, when monitoring the photosynthetic capacity is at the heart of field management and is essential for improving grape yield and quality. We measured the photosynthetic capacity of leaves under dark and light adaptation using different photochemical light intensities. When the leaves were placed in the dark for more than 30 min, the PSII reaction centres were completely opened (Yang et al., 2017). After dark adaptation, the leaves were irradiated with weak light to obtain the minimum fluorescence Fo and were then irradiated with higher intensity saturating light, a process that causes the electrons to leap from the ground state to obtain a maximum fluorescence Fm. Fv /Fm ((Fm-Fo)/Fm) reflects the potential photosynthetic capacity, which is sensitive to stressful conditions (e.g., water deficit). After dark adaptation, we measured rapid LRC using different actinic light intensities (116, 175, 262, 385, 574, 750, 1048, 1370 µmol m− 2 s− 1). LRC is a function of the ETR in response to PAR, as shown in the following equation.
ETR = ΦPSII • PPFD • Aleaf • fractionPSII
where ETR is the electron transfer rate in PSII, ΦPSII represents the actual quantum yield, and PPFD is the photosynthetically active photon flux density. Aleaf is the proportion of incident PPFD on the leaf that is absorbed by the leaf, and the value for higher plants is usually assumed to be 0.84, and fractionPSII is the fraction of absorbed PPFD that is received by PSII, usually assumed to be a constant of 0.5.
2.3.2. Water status parameters
We measured the leaf water potential (WP), relative water content (RWC), and equivalent water thickness (EWT) to evaluate the leaf water status. The predawn leaf water potential Ψpd is considered to be a good indicator of the plant water status in response to the environment (Pôças et al., 2020). However, Ψpd can only be measured in a short window before dawn, which limits its use. In this study, we used a PSYPRO water potential system (USA) to collect leaf water potential data from 8 am to midday. The detached leaves were quickly sent to the laboratory, and the fresh weight (FW) was recorded immediately using an analytical balance. After the collection of hyperspectral information, the turgid weight (TW) was determined after placing the leaves in deionized water for 8–12 h. Finally, the leaves were dried in an oven at 105 ◦ C for half an hour and then at 80 ◦ C until the dry weight (DW) was acquired. The RWC and ETW were calculated using the following equation.
RWC(%) = (FW − DW)/(TW − DW)
EWT = (FW − DW)/LA
where FW is the leaf fresh weight, TW is the turgid weight and DW is the dry leaf weight of all the leaves in the same sample plant, LA is the area of fresh leaf (cm2).
2.3.3. Determination of photosynthetic pigments
Chlorophyll measurements were carried out in parallel with chlorophyll fluorescence parameter measurements. A SPAD-502Plus metre (Konica Minolta Optics, Japan) was chosen as the measurement tool for chlorophyll, which proved to correlate well with chlorophyll and is a reliable method for nondestructive chlorophyll detection. SPAD values were measured for six different parts of each leaf, and the mean was calculated as the final measurement. The collected leaf samples were wrapped in cling film and quickly delivered to the laboratory where leaf area (LA) was accurately determined by square counting. All samples were then divided into two groups: one for the determination of leaf water status parameters (RWC, EWT) and the other for the determination of photosynthetic pigments, including the leaf nitrogen content (LNC) and carotenoid content. LNC was determined by the Kjeldahl method. A rectangular shredded sample (3.8 cm long and 3.5 cm wide) from different leaf positions was removed from each jar and placed in a quartz cuvette for spectrophotometric analysis (Ultrospec 3100 pro UV/vis spectrophotometer, Biochrom Ltd., Cambridge, England) of Chla, Chlb and carotenoid concentrations (mg⋅L− 1) derived for each sample by means of the following equations.
Carotenoids (mg⋅L− 1) = 4.92A474 − 0.0255[a] − 0.225[b].
Where [a] and [b] are the concentrations of chlorophyll a and chlorophyll b, respectively. Chlorophyll a(mg⋅L− 1)= 9.99A665-0.0872A642.5, Chlorophyll b(mg⋅L− 1) = 17.7A642.5-3.04A665. A474, A642.5 and A665 represent the spectrophotometer absorbance values at 474, 642.5 and 665 nm, respectively.
2.4. Leaf hyperspectral information collection
In this study, we used an imaging hyperspectral system to capture leaf spectral information. The whole process needs to be carried out in a relatively short period of time with the aim of preventing inactivation of detached leaves.
The indoor hyperspectral system consists of a hyperspectral camera (Pika L, Resonon, Bozeman, USA), halogen lamp, guide, motor and stand. The hyperspectral camera has a range of 400–1000 nm and is divided into 281 channels with a spectral resolution of 3.7 nm at a distance of 70 cm from the leaf sample. A halogen lamp is used as the measurement light source, which is preheated for more than 30 min before measurement to give a stable light source. The computer controls the speed of movement of the motor via SpectrononPro software (Resonon, USA), scans the blades and stores the images on the computer controller. The images were calibrated using a white board prior to acquisition. The acquired images were transformed to obtain the raw reflectance of the leaves. The Savitzky–Golay filter was used to smooth the spectral curve with a filter window of 7. The average spectrum of the freshly sampled leaves was obtained by creating an RoI.
2.5. Data analysis process
2.5.1. LRC model for ETR
The LRC process (Fig. 2) for ETR can be fitted by an exponential curve model incorporating PAR and ETRmax (Mariann and Proctor, 2004; Proctor and Bates, 2018). The LRC model was calculated using the following equation.
ETR = ETRmax (1 − e− kPAR)
Where ETR characterizes the electron transfer rate in PSII, ETRmax is the relatively stable maximum value of ETR, k is the rate constant, and kα is the initial slope, which is usually calculated from the rate of change of ETR at PAR< 200 µmol m− 2 s− 1.
2.5.2. Correlation analysis of photosynthetic pigments, water status parameters and photosynthetic performance
The influence of physicochemical parameters on photosynthetic performance is often present in an interactive manner, and this relationship is expressed as a physiological response. A direct description of the physiological reactions is the complex chemical reactions that exist between photosynthetic pigments and water status parameters. Therefore, there may not be a particular physicochemical parameter that significantly affects photosynthetic activity. Analysis of variance (ANOVA) can be used to measure the degree of significance between two factors, which can facilitate the identification of the key factors affecting the results and can also be used to evaluate insensitive factors. Therefore, ANOVA was used to further clarify the nonsignificant relationships between photosynthetic performance parameters and photosynthetic pigments (SPAD, LNC, carotenoids) and water status parameters (RWC, EWT, WP).
2.5.3. Vegetation indices
The photosynthetic pigments have a good response in the visible and NIR bands (400–760 nm), and the leaf water status parameters (RWC, EWT) show insensitivity in the visible and NIR bands (400–900 nm) but good sensitivity in the mid- and far-infra-red bands. Photosynthetic pigments and water status parameters can be quantified by constructing vegetation indices. Table 2 shows the vegetation indices screened from existing studies.
| Vegetation index | Formula | Parameters | Reference |
|---|---|---|---|
| Red edge chlorophyll index (CIred-edge) | (R800 /R720 ) − 1 | SPAD | Gitelson, 2005 |
| Ratio index (RI700/670) | R700 /R670 | SPAD | Zarco-Tejada et al., 2013a |
| Modified chlorophyll absorption ratio index (MCARI) | [R700 − R670 − 0.2(R700 − R500 )] | LNC | Zhao et al., 2018 |
| Photochemical reflectance index (PRI) | (R570 − R531 )/(R570 + R531 ) | Anthocyanins | Zarco-Tejada et al., 2013b |
| Ratio VI (RI515/570) | R515 /R570 | Carotenoids | |
| Normalized photochemical reflectance index (PRInorm) | PRI/[RDVI ∗ (R700/R670)] | Ψleaf | Zarco-Tejada et al., 2013a |
| Renormalized difference vegetation index (RDVI) | (R800 − R670 )/(R800 + R670 )0.5 | ||
| Water index (WI) | R900 /R970 | RWC | Penuelas et al., 1997 |
| Simple ratio water index (SRWI1070) | R1070 /R1340 | EWT | Yi et al., 2014 |
| Simple ratio water index (SRWI1640) | R1640 /R1060 | EWT |
2.5.4. PROSPECT model
The radiative transfer model (RTM) is based on radiative transfer theory and describes the rules of light radiation in the atmosphere and particle output in the medium. RTM can simulate vegetation bidirectional reflectance and canopy spectra, from which vegetation physiological and biochemical parameters can be retrieved (Cheng et al., 2006; Duan et al., 2014; Jay et al., 2017). The PROSPECT model is one of the most widely used RTMs and is derived from the flat plate model proposed by Allen et al. (1969) to simulate the directional-hemispherical reflectance and transmittance in the 400–2500 nm range. The PROSPECT model input parameters include two main categories: leaf structural parameters (N) and the leaf biochemical content (Govaerts et al., 1996). In the visible range, chlorophyll is considered the predominant photosynthetic pigment that absorbs light energy, (Feret et al., 2011) separating the contribution of chlorophyll and carotenoids to visible light and developing a version of PROSPECT-5. PROSPECT-D adds anthocyanins to PROSPECT-5, resulting in better retention of photosynthetic pigments and reduced uncertainty in model predictions (Féret et al., 2017). In this study, the 400–2500 nm spectral reflectance of leaves was simulated using PROSPECT-D with the model input parameters shown in Table 3. The reflectance at 1060, 1070, 1340 and 1640 nm was obtained by PROSPECT-D simulation to calculate SRWI1070 and SRWI1640.
| Parameters | Unit | Dataset 1 | Dataset 2 | Dataset 3 | Dataset 4 | Dataset 5 |
|---|---|---|---|---|---|---|
| Growth stages | —— | Fruiting stage | Turning stage | Mature stage | Harvest stage | After harvesting stage |
| Leaf structural parameter N | —— | 1.6–1.8 | 1.6–1.8 | 1.6–1.8 | 1.6–1.8 | 1.6–1.8 |
| Chlorophyll a & b content Cab | ug/cm2 | 31.9–47.5 | 33.4–47.9 | 34.1–47.9 | 35.4–49 | 31.8–45.2 |
| Carotene content Ccar | ug/cm2 | 0.0019–0.0028 | 0.0022–0.0032 | 0.0025–0.0035 | 0.0028–0.0033 | 0.0011–0.0016 |
| Anthocyanin content Cant | ug/cm2 | 1–3 | 1–3 | 1–3 | 1–3 | 1–3 |
| Brown pigment content Cb | ug/cm2 | 0 | 0 | 0 | 0 | 0 |
| Leaf water thickness Cw | g/cm2 | 0.0089–0.0147 | 0.0094–0.0152 | 0.0113–0.0149 | 0.0112–0.0149 | 0.0012–0.0144 |
| Leaf dry matter content Cm | g/cm2 | 0.003–0.008 | 0.004–0.008 | 0.007–0.009 | 0.005–0.009 | 0.0063–0.0082 |
2.5.5. Create a look-up table (LUT) database
To verify the theoretical calculations, a LUT was constructed containing the full range of variation, with a total of 100,000 samples. The LUT consists of 5 datasets (datasets 1–5), each containing 20,000 sets of samples, which represent the growing stages from grape fruiting to harvesting. Each dataset is based on the range of variation of the measured samples (see Table 4), and all obey a uniform distribution function, with the aim of making the LUT more realistic. Considering the effect of the structural parameters (N) on the simulated reflectance, the reflectance obtained from the simulation is pre-screened by the LUT method using the Pika L measured reflectance (400–1000 nm), which is based on a previous study of the sensitivity analysis of the input parameters of the PROSPECT-D model. Forty randomly selected parameter combinations from the database were tested on the SRWI1070 and SRWI1640 obtained from the PROSPECT model simulation, and the theoretical test results are shown in Fig. 3.
| Parameters | Unit | Dataset 1 | Dataset 2 | Dataset 3 | Dataset 4 | Dataset 5 |
|---|---|---|---|---|---|---|
| Growth stages | —— | Fruiting stage | Turning stage | Mature stage | Harvest stage | After harvesting stage |
| Fv/Fm | —— | 0.738–0.821 | 0.713–0.832 | 0.671–0.817 | 0.627–0.825 | 0.232–0.824 |
| ETRmax | —— | 80.49–91.03 | 51.33–94.95 | 57.42–98.15 | 42.06–98.15 | 25.37–92.57 |
| kα | —— | 0.187–0.214 | 0.147–0.224 | 0.133–0.232 | 0.097–0.232 | 0.060–0.218 |
| RWC | % | 67.4 – 86.9 | 68.2–85.6 | 85.9–93.2 | 85.1–93.2 | 91.6–94.6 |
| WP | —— | -3.88- − 1.21 | -3.49 − 0.97 | -2.24 - − 0.84 | -2.49—0.84 | -4.37- − 2.23 |
| LA | cm2 | 61.4–176.5 | 62.7–174.1 | 80.3–172 | 75–195.3 | 83.2–187 |
| LNC | mg/g | 0.61–0.87 | 0.63–0.89 | 0.58–0.86 | 0.64–0.96 | 0.80–0.93 |
2.5.6. BNN model
A neural network (NN) consists of a large number of nodes (or neurons) interconnected with each other, with each node representing a specific activation function. The hidden layer addresses complex nonlinear problems by associating input variables with response variables through weights (Liakos et al., 2018). A neural network can be obtained with unique weights; therefore, a neural network is also a conditional probability model (P(y|x, w|); where x is the input variable, y is the response variable and w is the weight, and the relationship between the input and response variables is obtained by maximum likelihood estimation (MLE). The prior probability of w is not assumed in MLE, so there is an equal chance that w will take any value. By applying Bayesian theory to the NN (BNN), the posterior distribution of estimated weights P(w|D|) = P(D|w|)P(w)/P(D), so that the weights of the BNN are no longer a constant value but a probability distribution. BNN predicts the posterior distribution of weights, thus preventing overfitting and improving model generalisation (Ma et al., 2021).
We designed a BNN model with two hidden layers to predict Fv/Fm, ETRmax, and kα (Fig. 3) using the vegetation index, which characterises leaf photosynthetic pigment and water status parameters as model input parameters. A recurrent structure (varying from 1 to 100) was used to determine the number of hidden layer neurons, and the optimal BNN model was determined by R2. The BNN model with two hidden layer neurons of 19 and 15 had the best performance for Fv/Fm, while ETRmax and kα had the best prediction with fewer hidden layer neurons (4 and 2 for the two hidden layer neurons, respectively). We chose ReLU as the activation function, and the training iterations were set to 1200 epochs. The BNN model performance was assessed through a real sample, which was an independent dataset (n = 50). The R2 and RMSE were calculated to assess the stability of the model.
To further assess the multiple colinearity problem between the input variables of the BNN model, we compared two other methods: (1) Partial least squares (PLS) which can avoid the multiple colinearity problem of the input variables and assess the variable importance in projection (VIP) and (2) PRI which involves photosynthetic system reactions, including the photosynthetic rate and light use efficiency (Sims et al., 2006; Suárez et al., 2010). Therefore, PRI can be a good indicator of photosynthetic performance. The PLS and PRI models were built using the same training dataset as the BNN model (Fig. 4), which ensures fairness of comparison.
3. Results
3.1. Time series variation of Fv/Fm, ETRmax and kα
Fv/Fm, ETRmax and kα showed some variability across years (Fig. 5). The Fv/Fm values were higher in 2021 than in 2020, and the same occurred for ETRmax and kα. Fv/Fm, ETRmax and kα showed a significant downward trend as the growing period progressed, whereas this pattern was not evident in 2021.
3.2. Relationships between Fv/Fm, ETRmax, and kα distribution and yield and quality
Fv/Fm, ETRmax and kα had a larger range of distribution in 2020 than in 2021 (Fig. 6), a difference that ruled out measurement timing reasons. The larger range of data distribution resulted in lower yields and relatively poorer quality (Fig. 7) but saved more irrigation water. The variation in irrigation water was closely related to rainfall and temperature during the growing season (Fig. 1), and these factors can significantly change the distribution range of Fv/Fm, ETRmax, and kα. Good field management can ensure the relative stability of the distribution range as a way to obtain better benefits.
3.3. Relationships between Fv/Fm, ETRmax, kα and photosynthetic pigments and water status parameters
To demonstrate the validity of the selected vegetation indices, ANOVA was used to evaluate the leaf water status and photosynthetic pigment parameters in relation to Fv/Fm, ETRmax, and kα (Fig. 8). The results showed that there were statistically significant differences between carotenoids and Fv/Fm in addition to the leaf water potential and kα (P < 0.05). No statistically significant differences existed between the remaining factors, suggesting that there may be an interaction between the intrinsic factors affecting photosynthetic performance. Photosynthetic performance is the result of these factors acting together, within which complex chemical reactions occur. Therefore, the selection of vegetation indices based on these factors is valid, and machine learning methods can further simplify the description of complex chemical reactions.
3.4. Relationship between vegetation index and photosynthetic pigments and water status parameters
The vegetation indices selected had a good relationship with the parameters (as shown in Fig. 9) The CIred-edge had the highest R2 with SPAD, indicating that the relationship between CIred-edge and SPAD is well adapted and is a reliable method for nondestructive measurement of SPAD. The water status parameter RWC had the lowest R2 compared to photosynthetic pigments, which also shows the uncertainty of the vegetation index in predicting RWC. SR1640 and SR1070 obtained by inversion of the PROSPECT model had a good relationship with EWT (Fig. 2).
3.5. BNN model prediction performance
The BNN model was tested for the predictive performance of Fv/Fm, ETRmax and kα (Fig. 10), and the results showed good predictive performance, especially for Fv/Fm, with an R2 of 0.78. The ETRmax and kα models had the same performance in the modelling dataset, which may have been influenced by the relationship between ETRmax and kα (Fig. 10 (b-c)). However, the BNN model outperformed kα for ETRmax, a comparison based on the same number of neurons in the hidden layer and adapted to a BNN model with fewer neurons, where a smaller number of neurons saved the time cost of convergence of the model compared to Fv/Fm (Fig. 10(a)), thus reducing the training complexity of the model itself. In deeper analysis, the BNN model was able to accurately simulate the nonlinear interaction between leaf biochemical parameters and photosynthetic activity, a process similar to the light-driven crop growth model, but greatly simplified the prediction of the photosynthetic capacity, which is essential for timely knowledge of crop yield and quality.
3.6. PLS and PRI model prediction performance
Compared to the BNN model, the PLS model (Fig. 11) and the PRI model (Fig. 12) had relatively weaker predictive performance for Fv/Fm, ETRmax and kα, which reflects the strengths of machine learning. Overall, all three models showed relatively poor reliability in predicting ETRmax, although in this study, despite the controlled actinic light intensity, the prediction of leaf photosynthetic performance under light conditions was unstable. The BNN model was able to improve this significantly, increasing the predicted R2 of ETRmax from 0.16 to 0.57. The superior predictive ability of the PLS model over the PRI model suggests that a single vegetation index is a limited predictor of leaf photosynthetic performance, and although the PRI has been shown to track photosynthetic system changes, it may still be limited by the effects of leaf water status and other photosynthetic pigments. The PRI model satisfactorily predicted Fv/Fm with an R2 of 0.52, which was significantly better than that of ETRmax and kα. This was also the case for the BNN and PLS models, indicating that monitoring the potential photosynthetic performance of leaves under dark adaptation is advantageous and relatively stable.
3.7. BNN model input feature importance analysis
We tested the importance of the BNN model input features using the Leave-One-Covariate-Out (LOCO) method. LOCO analysis evaluates the importance of a feature by comparing it to the original model through the change in prediction error after removing an input feature from the model (Lei et al., 2018; Molnar, 2020). In this case, if the removed feature plays an important role in the model, it will increase the prediction error of the model, thus indicating the importance of the feature. This has become an effective method for filtering features for machine learning models (Ma et al., 2021).
Fig. 13 shows the input feature importance (FI) of the BNN model calculated by the LOCO method. The results show that the selected vegetation indices had similar FIs, especially for the ETRmax model, indicating the validity of the selected vegetation indices in predicting leaf photosynthetic performance. In the Fv/Fm model, RI700/670 emerged as the most important feature, with SR1640 second only to RI700/670, indicating that the chlorophyll content and water status parameters were the two most important features. All selected vegetation indices showed almost equal importance in the ETRmax model, suggesting that ETRmax under light adaptation may be influenced by a variety of factors and that these intrinsic factors (water, photosynthetic pigments) are equally important. The kα prediction model had relatively large differences in FI values for each vegetation index, with CI, MCARI, RI515/700 and PRI570 being the most dominant factors. This indicates that at weaker PAR, the factors that induce changes in ETR in the BNN model simulating the chemical reactions occurring in the photosynthetic system are dominated by photosynthetic pigments and that water status parameters are not the dominant factors in the early stages of ETR.
4. Discussion
4.1. Spectral mechanisms and interannual performance of the BNN model
The physiological mechanisms regarding the BNN model were first established in the biochemical reactions of selected photosynthetic pigments and water status parameters with Fv/Fm, ETRmax and kα. ANOVA showed some differences in the contribution of photosynthetic pigments and water status parameters to the different photosynthetic reaction stages (Fig. 7). For the light saturation stage (ETRmax), photosynthetic pigment and water status parameters showed a strong interaction (no significance factor), which could be due to photoinhibition produced by stronger light intensity (Kalaji et al., 2017b). The second is whether photosynthetic pigment and water status parameters can be accurately quantified by spectral information. In the past studies, photosynthetic pigments and water status parameters are highly interpretable with spectral information. For example, (Croft et al., 2017) addressed that leaf chlorophyll content could measure leaf photosynthetic capacity. (Dechant et al., 2017) demonstrated that the relationship between leaf spectral information and nitrogen response could provide a mechanistic explanation for the spectral estimation of photosynthetic characteristic parameters (Vcmax, Jmax). Although the spectral responses of photosynthetic pigments and water status parameters provide strong mechanistic explanations for the spectral estimates of Fv/Fm, ETRmax and kα. However, the black-box process of machine learning methods still weakens the mechanistic interpretation of the simulation process. We still see many scholars providing explanations for this spectral-based machine learning simulation process. For example, Fu et al. (2020) simulated the spectral reflectance by PROCOSINE model to illustrate the spectral mechanism of photosynthetic pigments and water status parameters on Vcmax, Jmax. In this paper, we directly explain the spectral response mechanism of BNN model in estimating Fv/Fm, ETRmax and kα by Leave-One-Covariate-Out method. LOCO and ANOVA produced similar results, especially for ETRmax, and the FI value of LOCO also showed a strong interaction. However, at the same time, we see that different machine learning methods interpret the mechanism differently, which is limited by the algorithmic process of the model itself.
The performance of the BNN model validation dataset was evaluated across years (Fig. 14). We clearly see the impact of the distribution of the collected samples on the data-driven machine learning-based approach. For this purpose, we collected field samples from two years of different growing seasons. The severe drought suffered in 2021 caused large differences in the distribution of samples between years (Fig. 6). When the data were distributed over a larger range (Fig. 13(a), 2020), the model had superior robustness. This suggests that we need longer time series of field observations to obtain the best machine learning models, and in addition, interannual climate change presents new challenges for this purpose.
4.2. Importance evaluation of PLS model input variables
Calculating the variable importance in projection (VIP) of the input variables to the PLS model allows for an effective assessment of the multiple colinearity problem between variables (Zovko et al., 2019). Fig. 15 shows the VIP distribution for each input variable of the PLS model. For the Fv/Fm model (Fig. 15(a)), all input variables had VIP scores greater than 0.5, and the difference in VIP scores between variables was small (0.5–1.6), with PRI570 and PRInorm being the variables with VIP scores higher than 1. However, this was different for the ETRmax and kα models, where the variables with VIP scores greater than 1 included SR in addition to PRI570 and PRInorm, indicating that leaf photosynthetic performance was influenced by the interaction of the water status and photosynthetic pigments. Both PRI570 and PRInorm had relatively high VIP scores in the Fv/Fm, ETRmax and kα models, indicating that lutein cycle pigment changes are a major factor in assessing the potential and actual quantum yield of PSII. Both PRI570 and PRInorm had relatively high VIP scores in the Fv/Fm, ETRmax and kα models, indicating that changes in the de-epoxidation state of the xanthophyll cycle pigments are a major factor in assessing the potential and actual quantum yield of PSII. This was followed by RI515/570 and SR1640, indicating the importance of water status parameters and photosynthetic pigments. However, SR1070 did not score as well as SR1640 in terms of VIP, although both had similar results to EWT on the theoretical test (Fig. 2), suggesting that the vegetation indices chosen differed in the practical evaluation of photosynthetic performance.
4.3. Time-series effects of the PRI
To further evaluate whether the PRI model was affected by temporal variation, we compared the stability of the PRI model predictions at different growth stages between years. The relationship between PRI and Fv/Fm showed a decreasing trend with increasing growing season (Fig. 16), but the slope of this decreasing trend varied between years, which may have caused the prediction accuracy of the PRI model for Fv/Fm to be influenced by temperature, rainfall (Fig. 1) and field management. In addition, the seasonal variation in PRI response to the environment makes predictions at short time scales promising (Magney et al., 2016), thus potentially increasing instability when using the full range of data over the growing period for PRI predictions. It has been shown that PRI is significantly correlated with Fv/Fm at noon (Winkel et al., 2002); however, it is difficult to avoid the effects of daily scale time differences in a single measurement. Overall, the PRI model had relatively good predictions of Fv/Fm during late growth, mainly because leaf growth conditions during this period vary considerably vertically across the canopy, with leaves at the bottom of the canopy typically senescing more significantly than those at the top. This difference allowed for more variation in Fv/Fm values at the time of sample collection, and the wider sample range allowed for much better prediction accuracy.
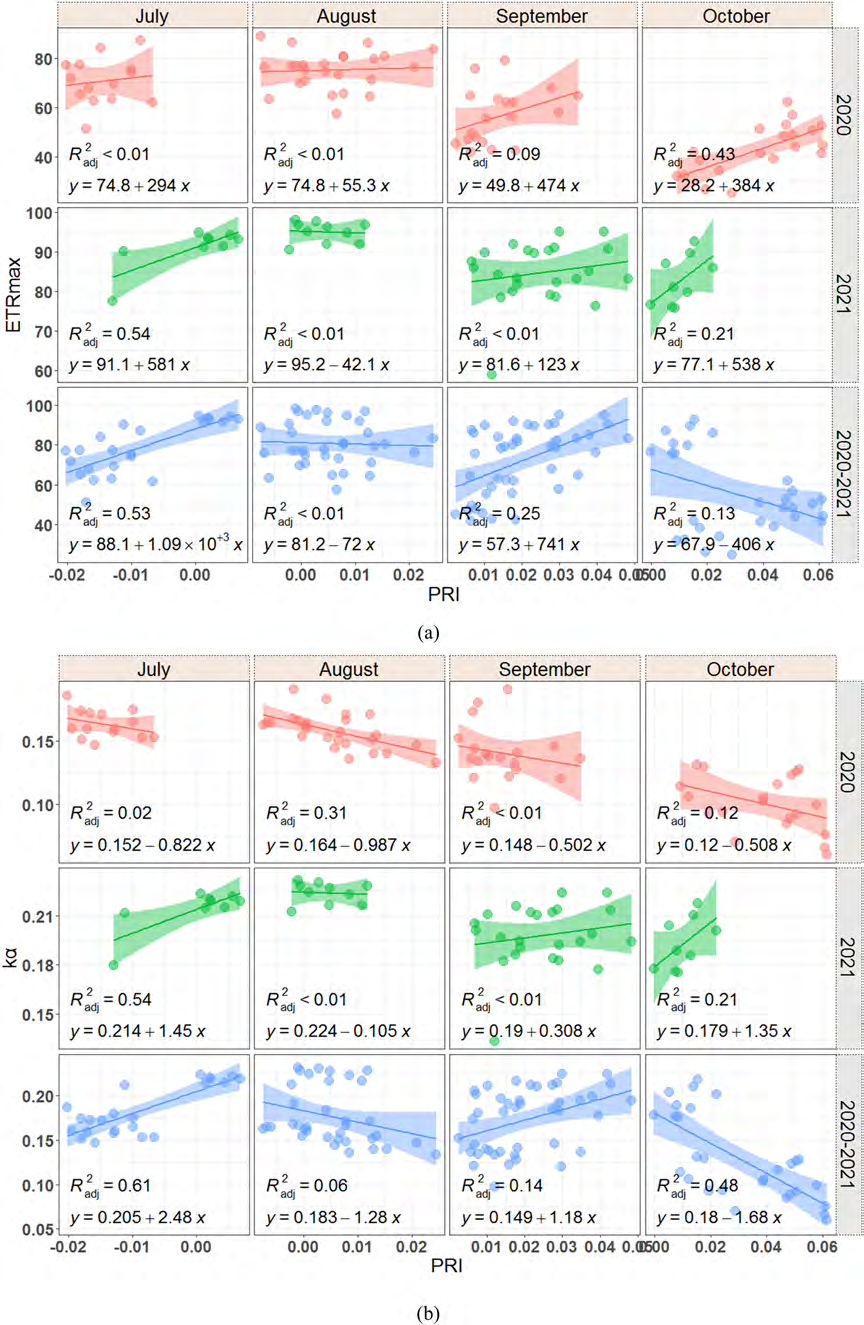
We analysed the relationship between the PRI model and ETRmax and kα at different growth stages between years (Fig. 14(a-b)). The PRI model showed a more consistent pattern with ETRmax and kα over the full sample (2020–2021), but there were differences between years, suggesting that ETRmax may not simply be influenced by the initial slope of ETR but also by light use efficiency (LUE) (Barton and North, 2001). In the time series, the PRI-ETRmax and PRI-kα models had better performance in July and October. In addition, dynamic changes in leaf biochemistry lead to problems with overlapping absorption coefficients of photosynthetic pigments (Ustin et al., 2009). Additionally, the mechanisms of photochemical quenching (NPQ) from PAR uptake by leaves differ; thus, the PRI is not well adapted to seasonal changes (Woodgate et al., 2019). The dynamics of the PRI-photosynthetic pigment relationship make it necessary to calibrate the predictions for ETR over long time series (Rahimzadeh-Bajgiran et al., 2012). The regression trend between PRI and ETRmax was similar to that of kα during the growing season in 2021, but in 2020, this relationship produced a larger difference, with lower yields and quality (Fig. 7). It is worth noting that long-term experimental observations are needed to determine whether the consistency of PRI with ETRmax and kα can be used as a valid evaluation of yield and quality. More data from different years, growth conditions and field management can be obtained to support the PRI model to evaluate the relationship between photosynthesis, yield and quality.
5. Conclusions
In this study, we observed the physicochemical parameters, yield and quality of grapes between different years, recorded the hyperspectral information of leaves, and finally developed a model for the evaluation of leaf photosynthetic performance based on hyperspectral techniques. The results showed that the leaf photosynthetic performance parameters Fv/Fm, ETRmax and kα were strongly correlated with yield and quality. Those vegetative indices characterising leaf water status and photosynthetic pigments can be used by machine learning methods to describe the complex chemical reactions taking place within the photosynthetic system, which can greatly simplify physical models driven by light energy and make it possible to rapidly evaluate leaf photosynthetic performance parameters. In terms of model prediction, compared with the PLS and PRI models, BNN significantly improved the prediction accuracy of the leaf photosynthetic performance parameters Fv/Fm, ETRmax and kα and had a fast convergence rate. Vegetation indices characterising photosynthetic pigments had the highest importance in the BNN model input features. In addition, the importance evaluation of the PLS model input variables showed that the highest VIP scores were for PRI570 and PRInorm, followed by SR1640. The results of the study may provide technical support for the determination of leaf photosynthetic performance by means of near-earth spectroscopy.
CRediT authorship contribution statement
Zhenfeng Yang: Data curation, Writing-Original draft preparation. Juncang Tian: Supervision. Zhi Wang: Conceptualization, Methodology. Kepeng Feng: Software, Validation.
Declaration of Competing Interest
We declare that we have no known competing financial interests or personal relationships that could have appeared to influence the work reported in this paper.
Acknowledgements
This work was supported by Ningxia Hui Autonomous Region Key Research and Development Plan Major Project (Grant No.2018BBF0202206, 2018BBF0202204), First-class discipline of Ningxia High Education Institutions (Water Engineering Discipline) funded project (Grant No. NXYLXK2021A03, NXYLXK2017A03), and Innovation Team of the “Chang Jiang Scholars and Innovation Team Development Programme” of the Ministry of Education (Grant No. IRT1067).
Figures
Fig. 1. Temporal distribution of diurnal temperature and rainfall in Yinchuan agricultural meteorological station. (a) 2020; (b) 2021.
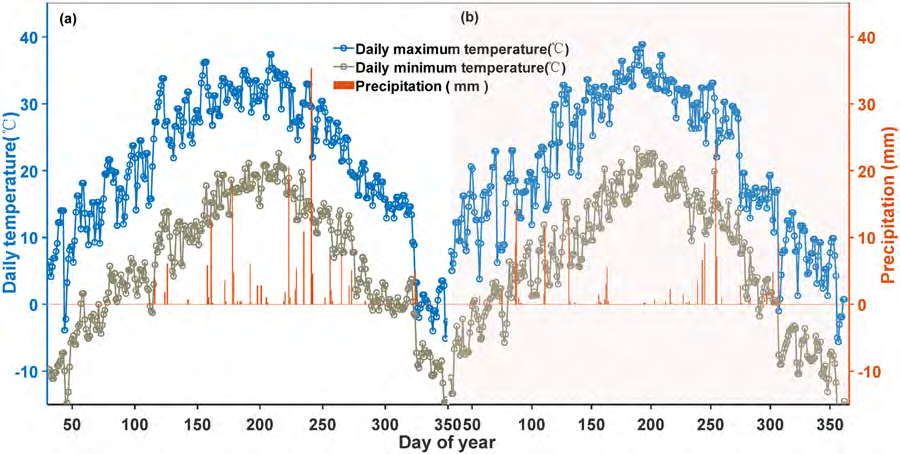
Fig. 2. LRC model fitting process for ETR.
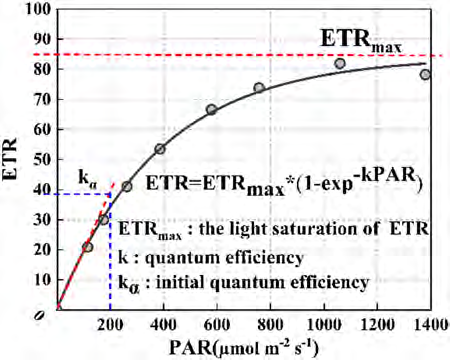
Fig. 3. Theoretical test results for SRWI1070 and SRWI1640.
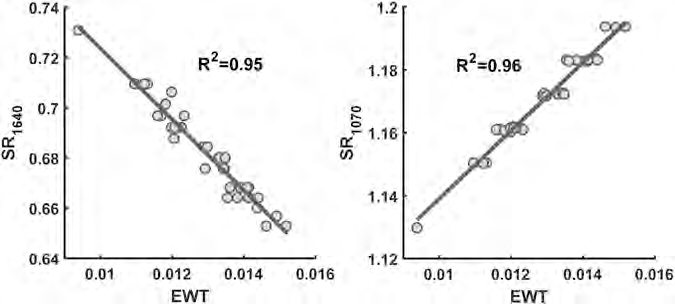
Fig. 4. Structure of the BNN model.
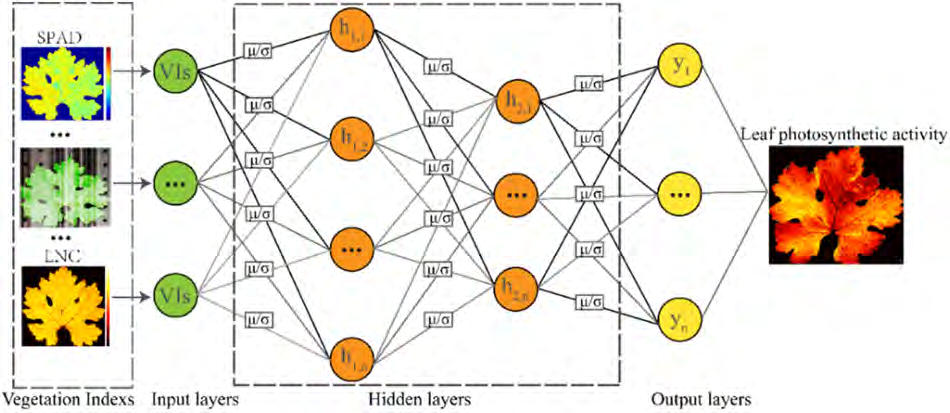
Fig. 5. Time series variation of Fv/Fm, ETRmax and kα.
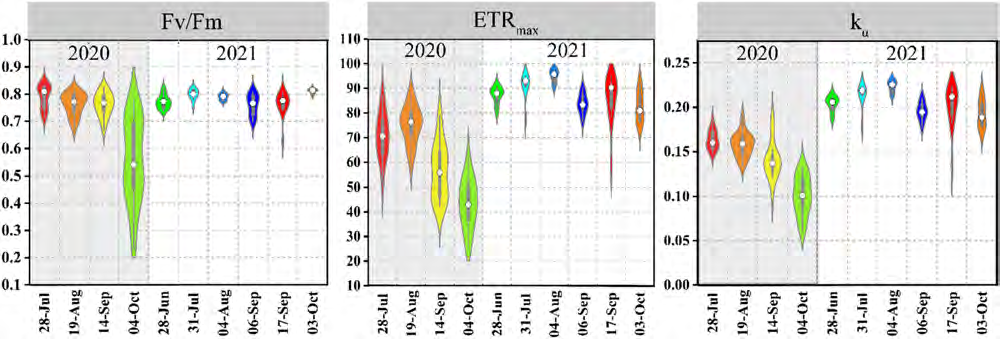
Fig. 6. Distribution curves for Fv/Fm, ETRmax and kα.
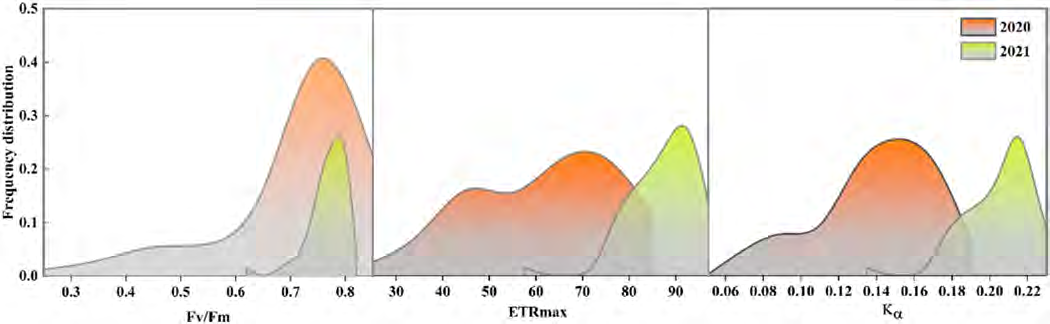
Fig. 7. Histogram of grape yield, quality and irrigation.
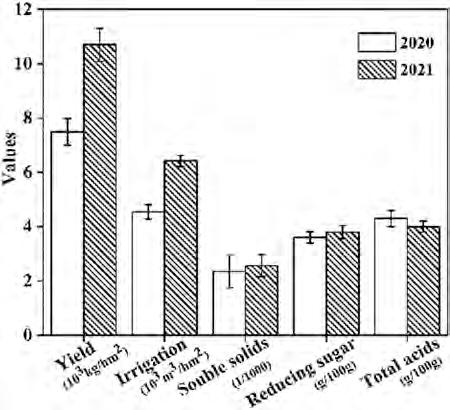
Fig. 8. ANOVA statistics of leaf water status and photosynthetic pigment parameters with Fv/Fm, ETRmax, and kα. (a) is the P value in ANOVA associated with Fischer’s test, P < 0.05 indicated that the difference was statistically significant. (b) is the F value of the F-test statistic, the larger the F, the more significant the effect between groups.
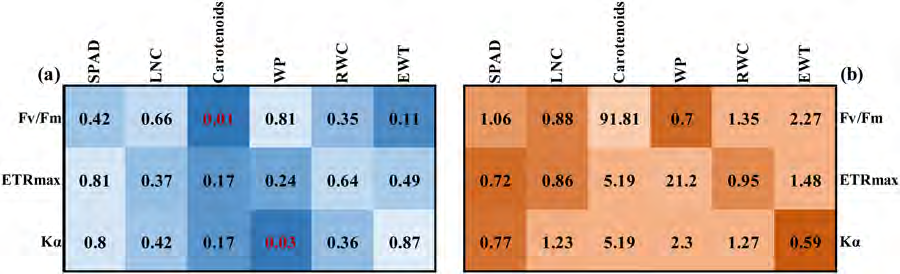
Fig. 9. Relationship between vegetation index and photosynthetic pigments, water status parameters.
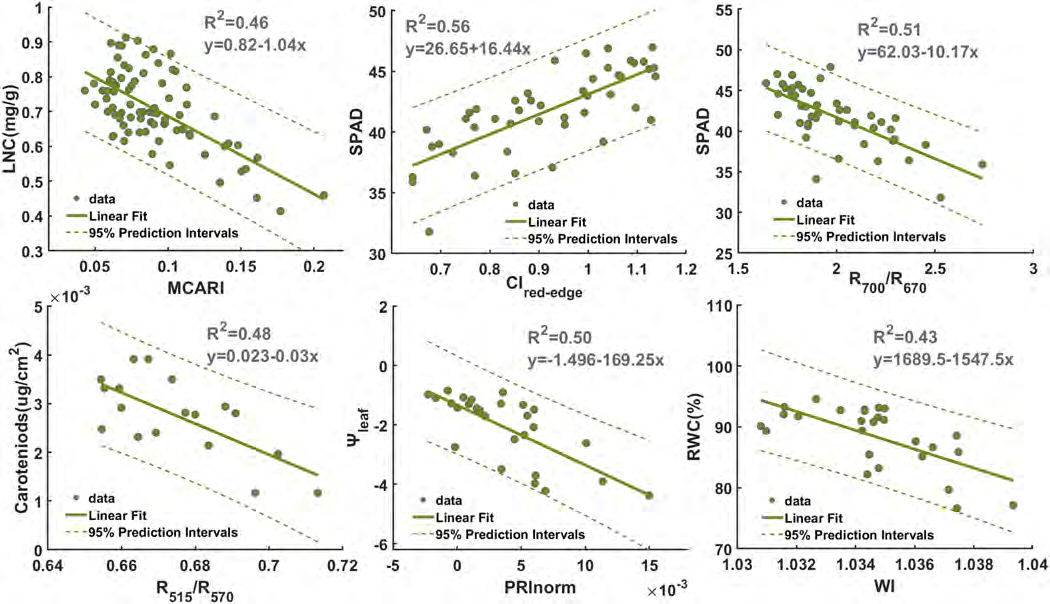
Fig. 10. Scatterplot of BNN model prediction performance.
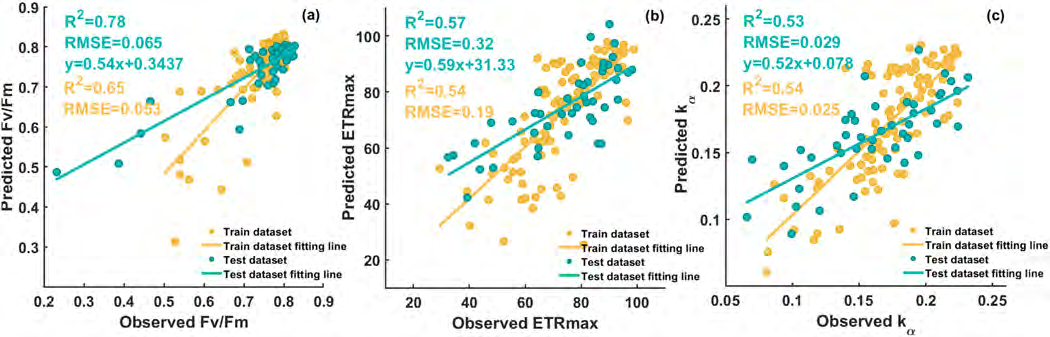
Fig. 11. Scatterplot of PLS model predicted performance.
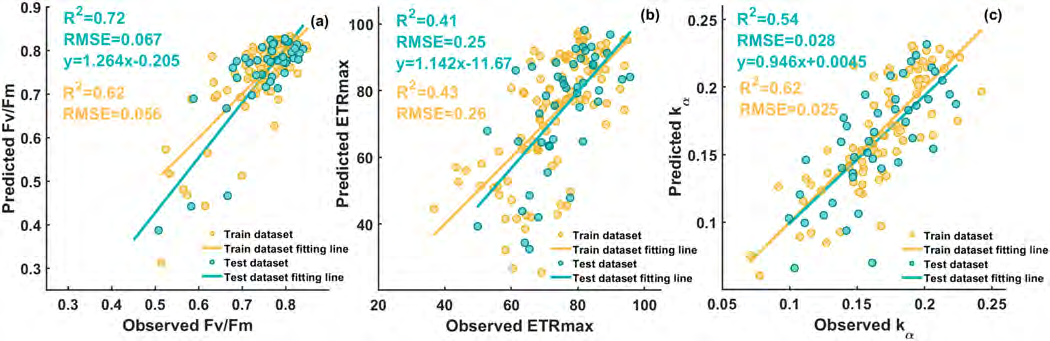
Fig. 12. Scatterplot of PRI model predicted performance.
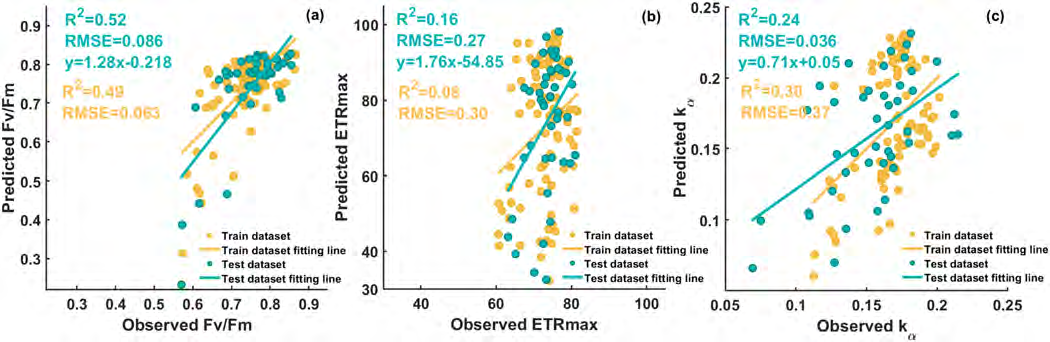
Fig. 13. Importance of input features for BNN model.
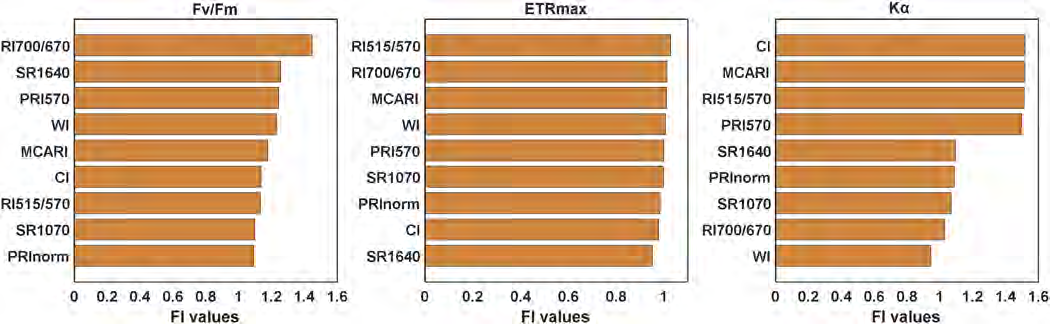
Fig. 14. Interannual performance of the BNN model.
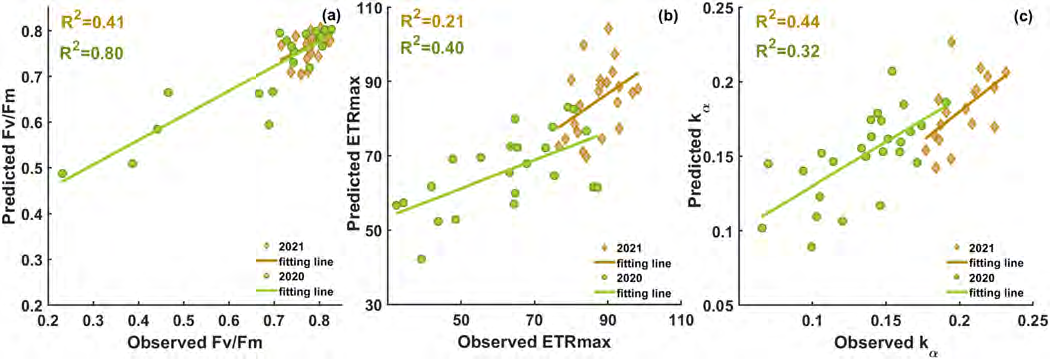
Fig. 15. Scatter plot of VIP scores for PLS model input variables.
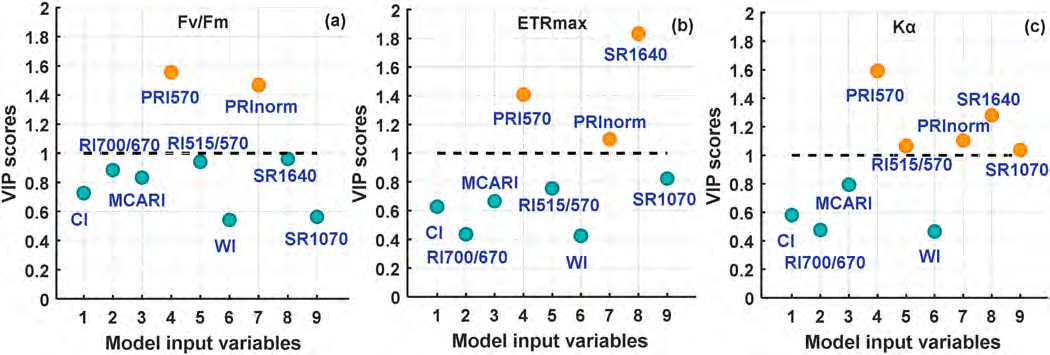
Fig. 16. Relationship between PRI models and Fv/Fm at different time scales.
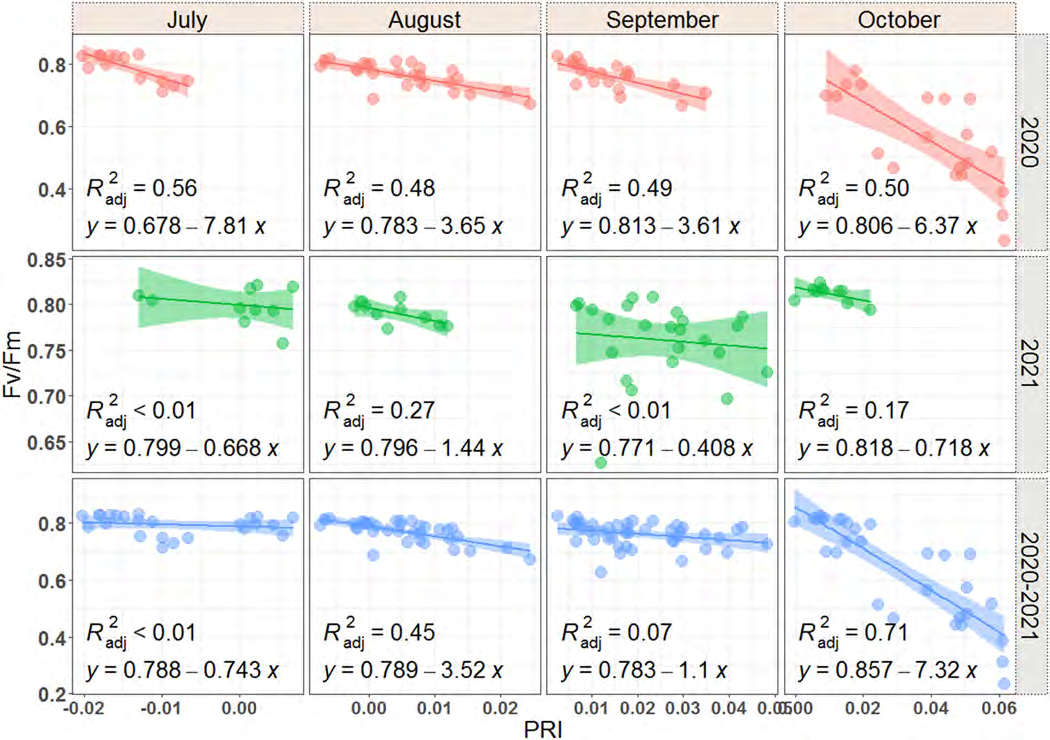
Fig. 17. Performance of the PRI model on different time scales. (a) is PRI-ETRmax, (b) is PRI-kα.
References
Abdalla, A., Cen, H., Wan, L., Mehmood, K., He, Y., 2020. Nutrient status diagnosis of infield oilseed rape via deep learning-enabled dynamic model. IEEE Trans. Ind. Inform. 17 (6), 4379–4388. https://doi.org/10.1109/TII.2020.3009736.
Ali, I., Greifeneder, F., Stamenkovic, J., Neumann, M., Notarnicola, C., 2015. Review of machine learning approaches for biomass and soil moisture retrievals from remote sensing data. Remote Sens. 7 (12), 16398–16421. https://doi.org/10.3390/rs71215841.
Allen, W.A., Gausman, H.W., Richardson, A.J., Thomas, J.R., 1969. Interaction of isotropic light with a compact plant leaf. JOSA 59 (10), 1376–1379. https://doi.org/10.1364/JOSA.59.001376.
Baker, N.R., 2008. Chlorophyll fluorescence: a probe of photosynthesis in vivo. Annu. Rev. Plant Biol. 59, 89–113. https://doi.org/10.1146/annurev.arplant.59.032607.092759.
Barbosa, A., Trevisan, R., Hovakimyan, N., Martin, N.F., 2020. Modeling yield response to crop management using convolutional neural networks. Comput. Electron. Agric. 170, 105197 https://doi.org/10.1016/j.compag.2019.105197.
Barton, C.V.M., North, P., 2001. Remote sensing of canopy light use efficiency using the photochemical reflectance index: model and sensitivity analysis. Remote Sens. Environ. 78 (3), 264–273. https://doi.org/10.1016/S0034-4257(01)00224-3.
Bellot, J., Maestre, F.T., Hernández, N., 2004. Spatio-temporal dynamics of chlorophyll fluorescence in a semi-arid Mediterranean shrubland. J. Arid Environ. 58 (3), 295–308. https://doi.org/10.1016/j.jaridenv.2003.08.009.
Camino, C., González-Dugo, V., Hernández, P., Sillero, J., Zarco-Tejada, P.J., 2018. Improved nitrogen retrievals with airborne-derived fluorescence and plant traits quantified from VNIR-SWIR hyperspectral imagery in the context of precision agriculture. Int. J. Appl. Earth Obs. 70, 105–117. https://doi.org/10.1016/j.jag.2018.04.013.
Chen, J.M., Liu, J., Leblanc, S.G., Lacaze, R., Roujean, J.-L., 2003. Multi-angular optical remote sensing for assessing vegetation structure and carbon absorption. Remote Sens. Environ. 84 (4), 516–525. https://doi.org/10.1016/S0034-4257(02)00150-5.
Chen, P., Haboudane, D., Tremblay, N., Wang, J., Vigneault, P., Li, B., 2010. New spectral indicator assessing the efficiency of crop nitrogen treatment in corn and wheat. Remote Sens. Environ. 114 (9), 1987–1997. https://doi.org/10.1016/j.rse.2010.04.006.
Cheng, Y.B., Zarco-Tejada, P.J., Ria?O, D., Rueda, C.A., Ustin, S.L., 2006. Estimating vegetation water content with hyperspectral data for different canopy scenarios: Relationships between AVIRIS and MODIS indexes. Remote Sens. Environ. 105 (4), 354–366. https://doi.org/10.1016/j.rse.2006.07.005.
Croft, H., Chen, J.M., Luo, X., Bartlett, P., Chen, B., Staebler, R.M., 2017. Leaf chlorophyll content as a proxy for leaf photosynthetic capacity. Glob. Change Biol. 23 (9), 3513–3524. https://doi.org/10.1111/gcb.13599.
Daumard, F., Champagne, S., Fournier, A., Goulas, Y., Ounis, A., Hanocq, J.-F., Moya, I., 2010. A field platform for continuous measurement of canopy fluorescence. IEEE Trans. Geosci. Remote. 48 (9), 3358–3368. https://doi.org/10.1109/TGRS.2010.2046420.
Dechant, B., Cuntz, M., Vohland, M., Schulz, E., Doktor, D., 2017. Estimation of photosynthesis traits from leaf reflectance spectra: correlation to nitrogen content as the dominant mechanism. Remote Sens. Environ. 196, 279–292. https://doi.org/10.1016/j.rse.2017.05.019.
Dong, T., Liu, J., Shang, J., Qian, B., Huffman, T., Zhang, Y., Champagne, C., Daneshfar, B., 2016. Assessing the impact of climate variability on cropland productivity in the canadian prairies using time series modis fapar. Remote Sens. 8 (4), 281. https://doi.org/10.3390/rs8040281.
Duan, S.B., Li, Z.L., Wu, H., Tang, B.H., Ma, L., Zhao, E., Li, C., 2014. Inversion of the PROSAIL model to estimate leaf area index of maize, potato, and sunflower fields from unmanned aerial vehicle hyperspectral data. Int. J. Appl. Earth Obs. 26, 12–20. https://doi.org/10.1016/j.jag.2013.05.007.
Feret, J.B., François, C., Asner, G.P., Gitelson, A.A., Martin, R.E., Bidel, L., Ustin, S.L., Maire, G.L., Jacquemoud, S., 2011. PROSPECT-4 and 5: Advances in the leaf optical properties model separating photosynthetic pigments. Remote Sens. Environ. 112 (6), 3030–3043. https://doi.org/10.1016/j.rse.2008.02.012.
Féret, J., Gitelson, A.A., Noble, S.D., Jacquemoud, S., 2017. PROSPECT-D: towards modeling leaf optical properties through a complete lifecycle. Remote Sens. Environ. 193, 204–215. https://doi.org/10.1016/j.rse.2017.03.004.
Fu, P., Meacham-Hensold, K., Guan, K., Wu, J., Bernacchi, C., 2020. Estimating photosynthetic traits from reflectance spectra: a synthesis of spectral indices, numerical inversion, and partial least square regression. Plant Cell Environ. 43 (5), 1241–1258.
Gitelson, A.A., Viña, A., Arkebauer, T.J., Rundquist, D.C., Keydan, G., Leavitt, B., 2003. Remote estimation of leaf area index and green leaf biomass in maize canopies. Geophys. Res. Lett. 30 (5). https://doi.org/10.1029/2002GL016450.
Gitelson, Anatoly, A., 2005. Remote estimation of canopy chlorophyll content in crops. Geophys. Res. Lett. 32, 403 do.http://doi.org/10.1029/2005GL022688.
Govaerts, Y.M., Jacquemoud, S., Verstraete, M.M., Ustin, S.L., 1996. Three-dimensional radiation transfer modeling in a dicotyledon leaf. Appl. Opt. 35 (33), 6585–6598. https://doi.org/10.1364/AO.35.006585.
Haghighattalab, A., González Pérez, L., Mondal, S., Singh, D., Schinstock, D., Rutkoski, J., Ortiz-Monasterio, I., Singh, R.P., Goodin, D., Poland, J., 2016. Application of unmanned aerial systems for high throughput phenotyping of large wheat breeding nurseries. Plant Methods 12 (1), 1–15. https://doi.org/10.1186/s13007-016-0134-6.
Hong, G., Abd El-Hamid, H.T., 2020. Hyperspectral imaging using multivariate analysis for simulation and prediction of agricultural crops in Ningxia, China. Comput. Electron. Agric. 172, 105355. https://doi.org/10.1016/j.compag.2020.105355.
Huang, W., Yang, S.-J., Zhang, S.-B., Zhang, J.-L., Cao, K.-F., 2012. Cyclic electron flow plays an important role in photoprotection for the resurrection plant Paraboea rufescens under drought stress. Planta 235 (4), 819–828. https://doi.org/10.1007/s00425-011-1544-3.
Inoue, Y., Peñuelas, J., Miyata, A., Mano, M., 2008. Normalized difference spectral indices for estimating photosynthetic efficiency and capacity at a canopy scale derived from hyperspectral and CO2 flux measurements in rice. Remote Sens. Environ. 112 (1), 156–172. https://doi.org/10.1016/j.rse.2007.04.011.
Jay, S., Gorretta, N., Morel, J., Maupas, F., Bendoula, R., Rabatel, G., Dutartre, D., Comar, A., Baret, F., 2017. Estimating leaf chlorophyll content in sugar beet canopies using millimeter- to centimeter-scale reflectance imagery. Remote Sens. Environ. 198, 173–186. https://doi.org/10.1016/j.rse.2017.06.008.
Jin, Y., Yang, X., Qiu, J., Li, J., Gao, T., Wu, Q., Zhao, F., Ma, H., Yu, H., Xu, B., 2014. Remote sensing-based biomass estimation and its spatio-temporal variations in temperate grassland, Northern China. Remote Sens. 6 (2), 1496–1513. https://doi.org/10.3390/rs6021496.
Jurjević, L., Liang, X., Gašparović, M., Balenović, I., 2020. Is field-measured tree height as reliable as believed–Part II, A comparison study of tree height estimates from conventional field measurement and low-cost close-range remote sensing in a deciduous forest. ISPRS J. Photogramm. 169, 227–241. https://doi.org/10.1016/j.isprsjprs.2020.09.014.
Kalaji, H.M., Schansker, G., Brestic, M., Bussotti, F., Calatayud, A., Ferroni, L., Goltsev, V., Guidi, L., Jajoo, A., Li, P., 2017a. Frequently asked questions about chlorophyll fluorescence, the sequel. Photosynth. Res. 132 (1), 13–66. https://doi.org/10.1007/s11120-017-0356-0.
Kalaji, M.H., Goltsev, V.N., Żuk-Golaszewska, K., Zivcak, M., Brestic, M., 2017b. Chlorophyll Fluorescence Understanding Crop: Performance–Basics and Applications. CRC Press.
Kamilaris, A., Prenafeta-Boldú, F.X., 2018. Deep learning in agriculture: a survey. Comput. Electron. Agric. 147, 70–90. https://doi.org/10.1016/j.compag.2018.02.016.
Lei, J., G’Sell, M., Rinaldo, A., Tibshirani, R.J., Wasserman, L., 2018. Distribution-free predictive inference for regression. J. Am. Stat. Assoc. 113 (523), 1094–1111. https://doi.org/10.1080/01621459.2017.1307116.
Liakos, K.G., Busato, P., Moshou, D., Pearson, S., Bochtis, D., 2018. Machine learning in agriculture: a review. Sensors 18 (8), 2674. https://doi.org/10.3390/s18082674.
Liu, Z., Guo, P., Liu, H., Fan, P., Zeng, P., Liu, X., Feng, C., Li, G., Tang, J., Peng, X., 2021. Gradient boosting estimation of the leaf area index of apple orchards in UAV remote sensing. Remote Sens. 13 (16), 3263. https://doi.org/10.3390/rs13163263.
Lobell, D.B., 2013. The use of satellite data for crop yield gap analysis. Field Crops Res. 143, 56–64. https://doi.org/10.1016/j.fcr.2012.08.008.
Lu, B., Dao, P.D., Liu, J., He, Y., Shang, J., 2020. Recent advances of hyperspectral imaging technology and applications in agriculture. Remote. Sens. 12 (16), 2659. https://doi.org/10.3390/rs12162659.
Ma, Y., Zhang, Z., Kang, Y., Özdoğan, M., 2021. Corn yield prediction and uncertainty analysis based on remotely sensed variables using a Bayesian neural network approach. Remote Sens. Environ. 259, 112408. https://doi.org/10.1016/j.rse.2021.112408.
Magney, T.S., Vierling, L.A., Eitel, J.U., Huggins, D.R., Garrity, S.R., 2016. Response of high frequency photochemical reflectance index (PRI) measurements to environmental conditions in wheat. Remote Sens. Environ. 173, 84–97. https://doi.org/10.1016/j.rse.2015.11.013.
Mariann, M., Proctor, M.C.F., 2004. Are bryophytes shade plants? Photosynthetic light responses and proportions of chlorophyll a, chlorophyll b and total carotenoids. Ann. Bot. 4, 593–603. https://doi.org/10.1093/aob/mch178.
Molnar, C., 2020. Interpretable machine learning. Lulu. com.
Ogaya, R., Penuelas, J., Asensio, D., Llusià, J., 2011. Chlorophyll fluorescence responses to temperature and water availability in two co-dominant Mediterranean shrub and tree species in a long-term field experiment simulating climate change. Environ. Exp. Bot. 71 (2), 123–127. https://doi.org/10.1016/j.envexpbot.2010.10.016.
Peng, Y., Gitelson, A.A., 2011. Application of chlorophyll-related vegetation indices for remote estimation of maize productivity. Agric. For. Meteorol. 151 (9), 1267–1276. https://doi.org/10.1016/j.agrformet.2011.05.005.
Penuelas, J., Pinol, J., Ogaya, R., Filella, I., 1997. Estimation of plant water concentration by the reflectance Water Index WI (R900/R970). Int. J. Remote Sens. 18 (13), 2869–2875. https://doi.org/10.1080/014311697217396.
Pôças, I., Tosin, R., Gonçalves, I., Cunha, M., 2020. Toward a generalized predictive model of grapevine water status in Douro region from hyperspectral data. Agric. For. Meteorol. 280, 107793. https://doi.org/10.1016/j.agrformet.2019.107793.
Prieto, P., Penuelas, J., Llusia, J., Asensio, D., Estiarte, M., 2009. Effects of long-term experimental night-time warming and drought on photosynthesis, Fv/Fm and stomatal conductance in the dominant species of a Mediterranean shrubland. Acta Physiol. Plant. 31 (4), 729–739. https://doi.org/10.1007/s11738-009-0285-4.
Proctor, M.C.F., Bates, J.W., 2018. Chlorophyll-fluorescence measurements in bryophytes: evidence for three main types of light-curve response. J. Bryol. 40 (1950), 1–11. https://doi.org/10.1080/03736687.2017.1407280.
Rahimzadeh-Bajgiran, P., Munehiro, M., Omasa, K., 2012. Relationships between the photochemical reflectance index (PRI) and chlorophyll fluorescence parameters and plant pigment indices at different leaf growth stages. Photosynth. Res. 113 (1), 261–271. https://doi.org/10.1007/s11120-012-9747-4.
Reichstein, M., Camps-Valls, G., Stevens, B., Jung, M., Denzler, J., Carvalhais, N., 2019. Deep learning and process understanding for data-driven Earth system science. Nature 566 (7743), 195–204. https://doi.org/10.1038/s41586-019-0912-1.
Romero, M., Luo, Y., Su, B., Fuentes, S., 2018. Vineyard water status estimation using multispectral imagery from an UAV platform and machine learning algorithms for irrigation scheduling management. Comput. Electron. Agric. 147, 109–117. https://doi.org/10.1016/j.compag.2018.02.013.
Sankaran, S., Khot, L.R., Carter, A.H., 2015. Field-based crop phenotyping: multispectral aerial imaging for evaluation of winter wheat emergence and spring stand. Comput. Electron. Agric. 118, 372–379. https://doi.org/10.1016/j.compag.2015.09.001.
Schlemmer, M., Gitelson, A., Schepers, J., Ferguson, R., Peng, Y., Shanahan, J., Rundquist, D., 2013. Remote estimation of nitrogen and chlorophyll contents in maize at leaf and canopy levels. Int. J. Appl. Earth Obs. 25, 47–54. https://doi.org/10.1016/j.jag.2013.04.003.
Shah, S.H., Angel, Y., Houborg, R., Ali, S., McCabe, M.F., 2019. A random forest machine learning approach for the retrieval of leaf chlorophyll content in wheat. Remote Sens. 11 (8), 920. https://doi.org/10.3390/rs11080920.
Sims, D.A., Luo, H., Hastings, S., Oechel, W.C., Rahman, A.F., Gamon, J.A., 2006. Parallel adjustments in vegetation greenness and ecosystem CO2 exchange in response to drought in a Southern California chaparral ecosystem. Remote Sens. Environ. 103 (3), 289–303. https://doi.org/10.1016/j.rse.2005.01.020.
Suarez, L., Zhang, P., Sun, J., Wang, Y., Poblete, T., Hornero, A., Zarco-Tejada, P., 2021. Assessing wine grape quality parameters using plant traits derived from physical model inversion of hyperspectral imagery. Agric. For. Meteorol. 306, 108445. https://doi.org/10.1016/j.agrformet.2021.108445.
Suárez, L., Zarco-Tejada, P.J., Sepulcre-Cantó, G., Pérez-Priego, O., Miller, J., Jiménez-Muñoz, J., Sobrino, J., 2008. Assessing canopy PRI for water stress detection with diurnal airborne imagery. Remote Sens. Environ. 112 (2), 560–575. https://doi.org/10.1016/j.rse.2007.05.009.
Suárez, L., Zarco-Tejada, P.J., González-Dugo, V., Berni, J., Sagardoy, R., Morales, F., Fereres, E., 2010. Detecting water stress effects on fruit quality in orchards with time-series PRI airborne imagery. Remote Sens. Environ. 114 (2), 286–298. https://doi.org/10.1016/j.rse.2009.09.006.
Ustin, S.L., Gitelson, A.A., Jacquemoud, S., Schaepman, M., Asner, G.P., Gamon, J.A., Zarco-Tejada, P., 2009. Retrieval of foliar information about plant pigment systems from high resolution spectroscopy. Remote Sens. Environ. 113, S67–S77. https://doi.org/10.1016/j.rse.2008.10.019.
Watanabe, K., Guo, W., Arai, K., Takanashi, H., Kajiya-Kanegae, H., Kobayashi, M., Yano, K., Tokunaga, T., Fujiwara, T., Tsutsumi, N., 2017. High-throughput phenotyping of sorghum plant height using an unmanned aerial vehicle and its application to genomic prediction modeling. Front. Plant Sci. 8, 421. https://doi.org/10.3389/fpls.2017.00421.
Winkel, T., Méthy, M., Thénot, F., 2002. Radiation use efficiency, chlorophyll fluorescence, and reflectance indices associated with ontogenic changes in water-limited Chenopodium quinoa leaves. Photosynthetica 40 (2), 227–232. https://doi.org/10.1023/A:1021345724248.
Wolanin, A., Camps-Valls, G., Gómez-Chova, L., Mateo-García, G., van der Tol, C., Zhang, Y., Guanter, L., 2019. Estimating crop primary productivity with Sentinel-2 and Landsat 8 using machine learning methods trained with radiative transfer simulations. Remote Sens. Environ. 225, 441–457. https://doi.org/10.1016/j.rse.2019.03.002.
Woodgate, W., Suarez, L., Van Gorsel, E., Cernusak, L., Dempsey, R., Devilla, R., Held, A., Hill, M., Norton, A., 2019. tri-PRI: a three band reflectance index tracking dynamic photoprotective mechanisms in a mature eucalypt forest. Agric. For. Meteorol. 272, 187–201. https://doi.org/10.1016/j.agrformet.2019.03.020.
Yang, H., Yang, X., Zhang, Y., Heskel, M.A., Lu, X., Munger, J.W., Sun, S., Tang, J., 2017. Chlorophyll fluorescence tracks seasonal variations of photosynthesis from leaf to canopy in a temperate forest. Glob. Change Biol. 23 (7), 2874–2886. https://doi.org/10.1111/gcb.13590.
Yang, Z., Tian, J., Feng, K., Gong, X., Liu, J., 2021. Application of a hyperspectral imaging system to quantify leaf-scale chlorophyll, nitrogen and chlorophyll fluorescence parameters in grapevine. Plant Physiol. Biochem. 166, 723–737. https://doi.org/10.1016/j.plaphy.2021.06.015.
Yi, Q., Wang, F., Bao, A., Jiapaer, G., 2014. Leaf and canopy water content estimation in cotton using hyperspectral indices and radiative transfer models. Int. J. Appl. Earth Obs. 33, 67–75. https://doi.org/10.1016/j.jag.2014.04.019.
Zarco-Tejada, P.J., González-Dugo, V., Williams, L., Suarez, L., Berni, J.A., Goldhamer, D., Fereres, E., 2013a. A PRI-based water stress index combining structural and chlorophyll effects: Assessment using diurnal narrow-band airborne imagery and the CWSI thermal index. Remote Sens. Environ. 138, 38–50. https://doi.org/10.1016/j.rse.2013.07.024.
Zarco-Tejada, P.J., Guillén-Climent, M.L., Hernández-Clemente, R., Catalina, A., González, M.R., Martín, P., 2013b. Estimating leaf carotenoid content in vineyards using high resolution hyperspectral imagery acquired from an unmanned aerial vehicle (UAV. Agric. For. Meteorol. 171–172, 281–294. https://doi.org/10.1016/j.agrformet.2012.12.013.
Zhang, L., Niu, Y., Zhang, H., Han, W., Li, G., Tang, J., Peng, X., 2019. Maize canopy temperature extracted from UAV thermal and RGB imagery and its application in water stress monitoring. Front. Plant Sci. 1270. https://doi.org/10.3389/fpls.2019.01270.
Zhang, Y.-L., Hu, Y.-Y., Luo, H.-H., Chow, W.S., Zhang, W.-F., 2011. Two distinct strategies of cotton and soybean differing in leaf movement to perform photosynthesis under drought in the field. Funct. Plant Biol. 38 (7), 567–575. https://doi.org/10.1071/FP11065.
Zhao, B., Duan, A., Ata-Ul-Karim, S.T., Liu, Z., Chen, Z., Gong, Z., Zhang, J., Xiao, J., Liu, Z., Qin, A., 2018. Exploring new spectral bands and vegetation indices for estimating nitrogen nutrition index of summer maize. Eur. J. Agron. 93, 113–125. https://doi.org/10.1016/j.eja.2017.12.006.
Zovko, M., Žibrat, U., Knapič, M., Kovačić, M.B., Romić, D., 2019. Hyperspectral remote sensing of grapevine drought stress. Precis. Agric. 20 (2), 335–347. https://doi.org/10.1007/s11119-019-09640-2.
This HTML version was generated with AI assistance and may contain errors or omissions. The original approved PDF remains the official document of record. An alternative accessible format is available upon request from the document creator in accordance with Title II of the ADA.